What's Really Driving Stocks?
Priced To Perfection
Another record close on the S&P 500 this week has reignited a longstanding debate over whether high valuations have priced stocks for perfection. If so, some argue that even the smallest hiccup could cause stocks to fall.
It’s happened before. In early 2000, right around the time the dot-com bubble burst, there were stocks trading at valuations that looked like typos. We all know how that story ended.
Spotting bubbles and recognizing when asset prices detach from reality can prevent life-altering mistakes. But before we determine if stocks are overpriced, let’s first discuss the concept of valuation and recognize its limitations.
Price vs. Value
Warren Buffett once said, “Price is what you pay, value is what you get.” On its own, price offers no insight into the value of an asset. A $1,000 stock could be a bargain compared to a $10 stock, just as a $1 million home could be a steal when compared to a $100,000 home.
Therefore, we use metrics that compare assets on a level playing field. In real estate, price-per-square-foot is commonly used since most shoppers value square footage.
The price-to-earnings ratio (P/E ratio) is a common valuation metric for stocks because investors typically value earnings. The intuition is analogous to real estate. How much someone is willing to pay for $1 of company earnings is no different than what a home buyer is willing to pay for a single square foot of a house.
Nearly any characteristic can be used to assess value. If a home buyer cares more about the number of bedrooms instead of overall size, he can just as easily use price-per-bedroom.
Similarly, some stocks are owned to generate income, so these tend to be valued on the cash they generate. Younger companies tend to be valued on a price-per-sales basis because revenue usually matters more than profits earlier on.
It’s All Relative
On their own, valuation measures are practically useless. In fact, Vanguard published a report in 2012 that concluded the P/E ratio and other valuation metrics have been unable to predict the future of stock prices since 19262.
Therefore, any pundit who claims that the stock market is going to crash solely due to a high P/E ratio should be ignored for the same reason a bull should be for recommending the stock market because of a low P/E ratio.
Valuation analysis is often more art than science, but there are three factors that should be considered to provide structure to any evaluation. The first is likeness.
If a home buyer were to determine that a house is selling for $500 per square foot, this would not be enough to tell her if she is getting a deal. Paying $500/sqft in rural Wyoming would be a rip-off, but that same price in lower Manhattan is a bargain.
Comparing a utility stock to a technology stock would also make little sense. The former tends to be used for income and the latter for growth. It’s apples and oranges.
The second is quality. If new construction is selling for $500/sqft, it would be unfair to compare a fixer-upper to a move-in ready house with top of the line appliances.
Stocks work the same way. Since we are valuing the earnings, we must compare both the quality and expected growth. A high P/E ratio is often justified if future earnings appear attractive. A low P/E ratio should be expected when less attractive.
The third is the current and projected path for interest rates. This is gravity for all financial assets and critically important for valuation analysis. For example, when interest rates are low, people typically buy more houses, which raises the price of real estate. The same applies to stocks. Relatively low interest rates pull down investment returns in cash and bonds to the point where investors are forced to buy stocks. This causes P/E ratios to rise.
If this phenomenon sounds eerily familiar, it is because this is precisely what happened following the financial crisis. Shortly after the Fed’s decision to drop interest rates to zero, investors who needed income fled from cash investments to find better returns.
The next stop up the “risk curve” was bonds. As investors bought more bonds, prices rose. This brought down the income generated by these bonds to where even they could no longer pay the bills. It didn’t take long until investors moved into stocks due to lack of options.
Therefore, a stock market with a relatively high P/E ratio may not be overvalued if today’s interest rates are comparatively low. Where investors can get in trouble (and where bubbles can form) is when valuation metrics and interest rates are both relatively high. That usually ends badly.
Let’s Try
According to FactSet, the P/E ratio for the S&P 500 on August 23rd was 25.98 times forward earnings (earnings expectations for 2021). This is a level not seen since September 20001. Furthermore, the average ratio over the last 25 years has been 16.33. Since the current P/E ratio is not only above its average but the highest in two decades, it may appear that stocks are dangerously overvalued.
However, as explained above, this is not enough. We must assess the quality of earnings and the projected path of interest rates. The challenge right now is that we’ve never been through anything quite like this before (likeness), but let’s try anyway.
The chart below shows that earnings expectations have changed dramatically since the beginning of the year. This is a massive shift in six months and indicative of just how much uncertainty is out there.
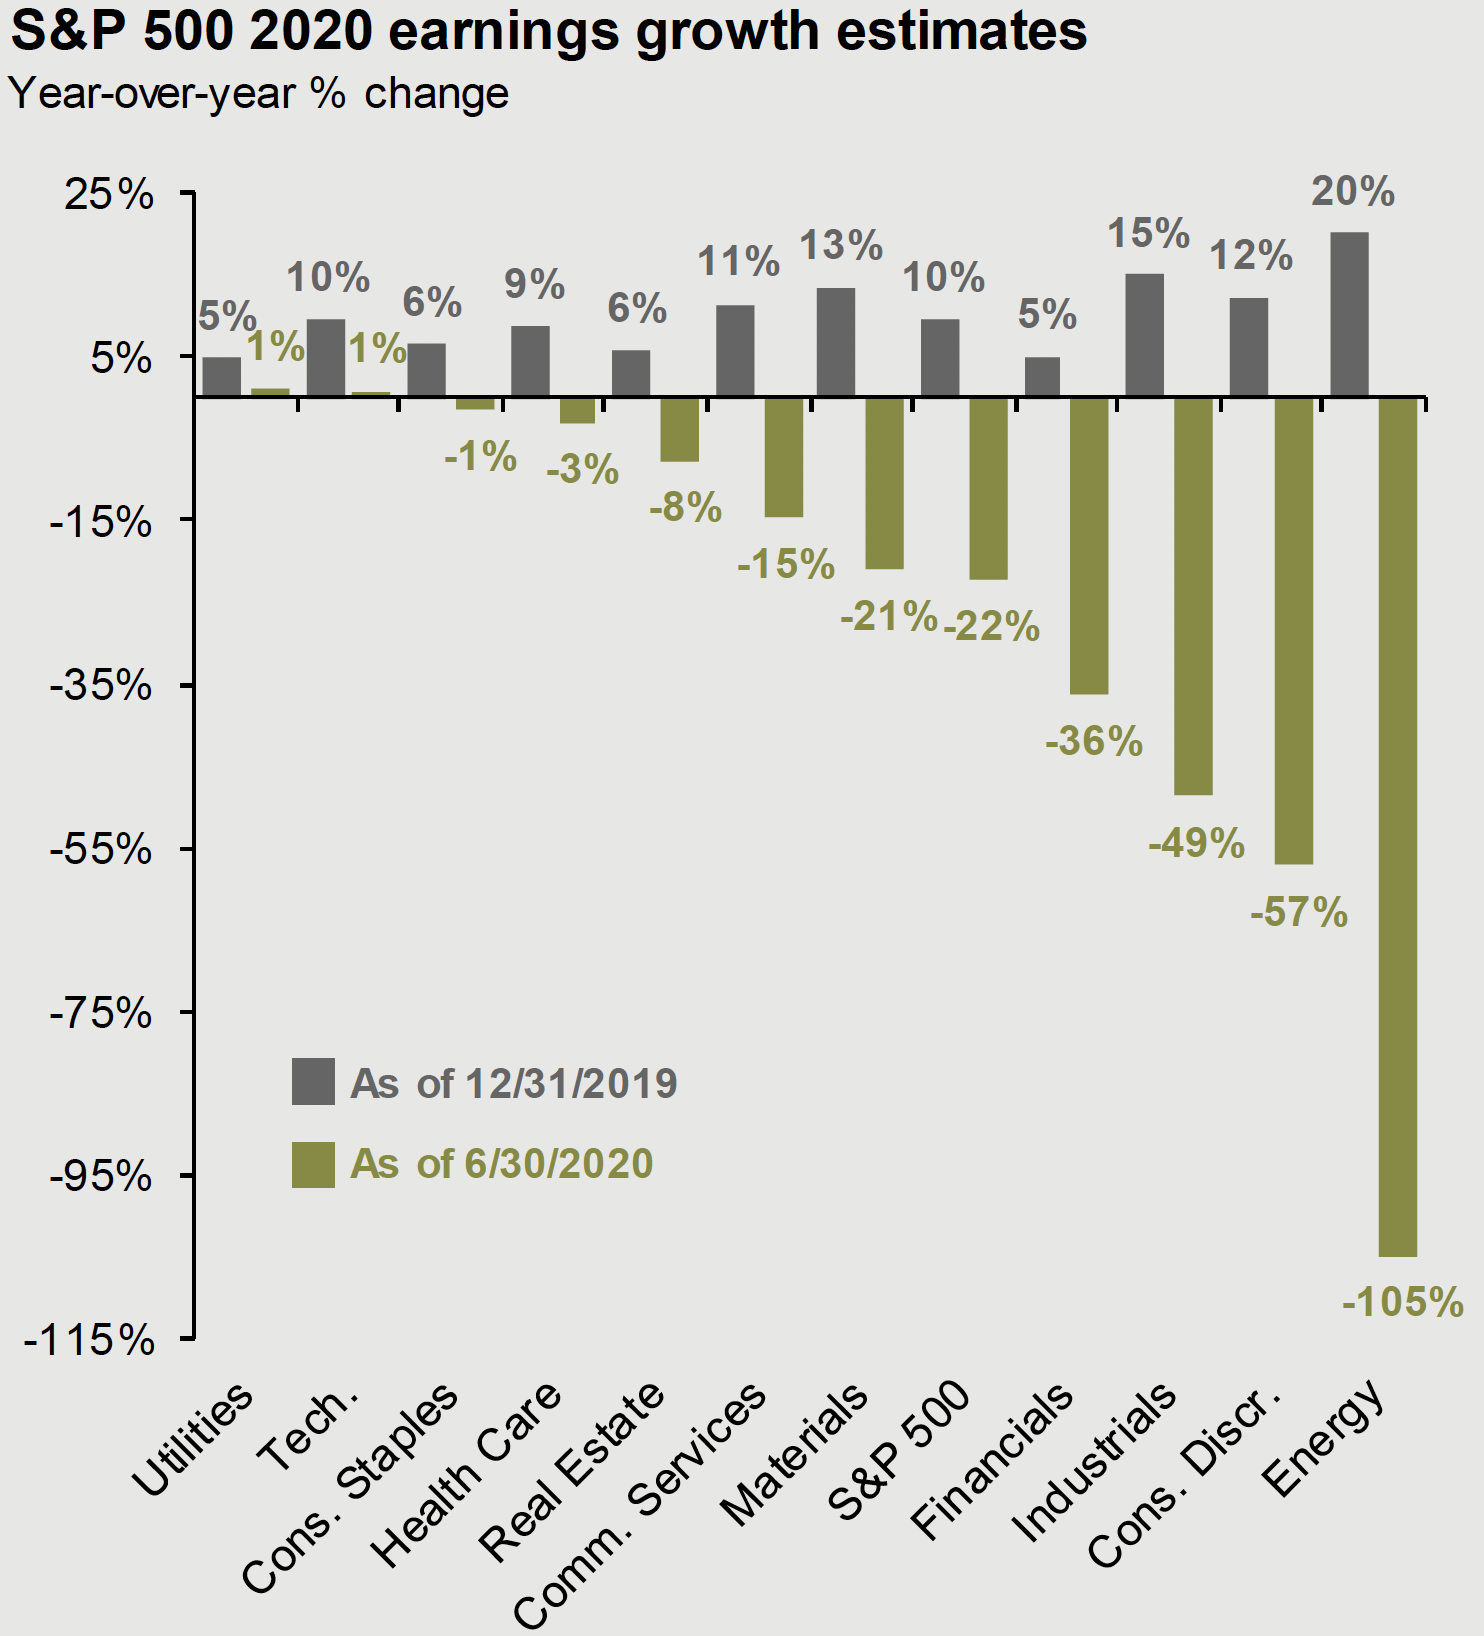 Source: J.P. Morgan Guide to the Markets – Data are as of June 30, 2020.
Another challenge is the composition of the S&P 500. Bigger companies are carrying more weight these days, and as of August 21st, just six stocks represented 26.5% of the total size of the S&P 5004. Other sectors like department stores and airlines are down 63% and 52% respectively, but they only account for 0.01% and 0.18% of the S&P 5005. Meaning, some earnings expectations matter a lot more to the index than others.
In fact, it’s hard to find a time in history where there has been such a bifurcation between the haves and have nots in the S&P 500. This disparity makes any earnings forecast and/or quality assessment for the broader index very difficult. Several companies have even suspended forward guidance on earnings. If management doesn’t have a clue what the future holds for earnings, investors likely have no shot.
Fortunately, earnings matter a lot less when the most powerful financial force in the known universe is supporting the stock market. What’s also great about the Fed is they just tell us what they plan to do. We don’t have to guess or forecast or do much thinking at all. Fed Chairman Jerome Powell told the world everything we need to know following the Fed’s June meeting6:
“We’re not even thinking about thinking about raising rates.”
That’s not a copy and paste error either. He literally said “thinking about” twice in a row. As in, the thought of raising interest rates is so far out that it hasn’t crossed their minds to even start thinking about it yet. If the Fed holds true to their word, then stocks could very well go a lot higher (irrespective of what happens to earnings).
The Bottom Line
Those who have sprained an ankle know all too well that while the injury can happen in the blink of an eye, the recovery takes time. Doctors often prescribe crutches to injured patients to help them get on with their lives (albeit at a slower pace).
This is precisely what the Fed is doing for the economy today. They realize that the economy needs time to heal, so they gave it crutches to facilitate its rehabilitation.
It’s nearly identical to the treatment administered after the financial crisis. Drop interest rates to zero, buy a bunch of bonds to keep borrowing costs low and stock prices propped up, and keep markets fluid until the fundamentals get strong enough to support the economy on their own.
Only this time, investors knew what to expect. They’ve already seen this playbook work and appear confident that the Fed can pull it off again. That’s probably why the stock market recovered in a matter of months versus the years it took after the financial crisis. It’s been a Pavlovian response. Those who bought stocks after 2008 likely profited, and the anticipation of a repeat sped up the recovery this time.
Said another way, when critics argue that the stock market isn’t trading on fundamentals, they are probably right. The Fed is what matters most right now, so to see the market tank would likely require a premature removal of their crutches (similar to what would happen if an injured ankle was put to the test too soon).
Some may argue that this is artificial. It’s manufactured rather than the byproduct of free market capitalism and/or a healthy economy. Perhaps, but does that matter?
All crutches are artificial. It’s not a person’s real legs, muscles, and tendons that do the walking. Those are injured, so the patient relies upon a man-made device until strong enough to walk again. Isn’t this better than being relegated to a bed for weeks?
Furthermore, isn’t it a good thing that the Fed exists to help investors during times like these? This recession didn’t happen because of overspending or too much debt. This wasn’t a bailout. It was a lifeline. Sure, there will be unintended consequences down the road, but would we really be better off without their help?
The bottom line is that valuation metrics are a lot less relevant when the stock market doesn’t trade on them. This appears to be the case today, and that’s ok. They will be back in vogue one day, but for now, all eyes remain on the Fed.
Sincerely,

Mike Sorrentino, CFA
Chief Investment Officer

Brian Malizia, President
Three Key Points
- The forward P/E ratio for the S&P 500 is the highest it’s been in two decades.
- This has fueled concern that the stock market is overvalued.
- Before doing any valuation analysis, it’s important to better understand what could be driving stocks at the moment.
Sources
1 https://www.wsj.com/articles/the-median-s-p-stock-has-never-been-more-expensive-11598202000
2 https://personal.vanguard.com/pdf/s338.pdf
3 J.P. Morgan, Guide to The Markets 1Q 2020
4 https://www.yardeni.com/pub/faangms.pdf
Disclosures
This material has been prepared for informational purposes only and should not be construed as a solicitation to effect, or attempt to effect, either transactions in securities or the rendering of personalized investment advice. This material is not intended to provide, and should not be relied on for tax, legal, investment, accounting, or other financial advice. Jay Street does not provide tax, legal, investment, or accounting advice. You should consult your own tax, legal, financial, and accounting advisors before engaging in any transaction. Asset allocation and diversification do not guarantee a profit or protect against a loss. All references to potential future developments or outcomes are strictly the views and opinions of Jay Street and in no way promise, guarantee, or seek to predict with any certainty what may or may not occur in various economies and investment markets. Past performance is not necessarily indicative of future performance.